Search This Blog

Support and Resistance

The most basic and important step during chart analysis is marking the support and resistance areas. Support and Resistance play an integral part in any successful trading strategy. So first lets look in to what is support and resistance.

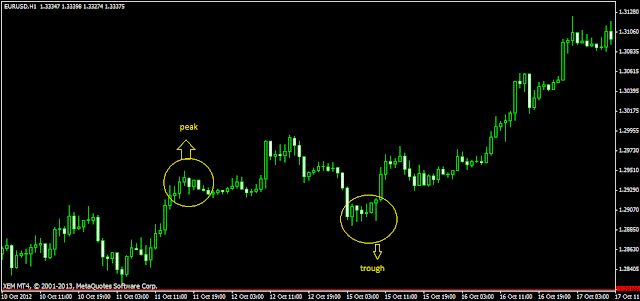
Let's look in to a candlestick chart of EUR-USD.
Chart shows waht a peak and trough is

In this chart we can see that the price is moving up.The price on 10th October was around 1.2868 and as on 17th October it is around 1.3117. So the price has moved up for about 249 pips. But the movement is not through a straight line. After 10th October the price has come down and the again went up till 11th October then again it came down and so on.The price has created a number of high's and low's before reaching the value of 1.3117.

The yellow circle you see in the chart is one such high and it is called a PEAK.

Candlestick chart pattern-Part II- Hammer/Hangingman

Hammer/Hanging man.

This is a reversal signal,which indicates that there is a chance for change in the direction of price.
hanging man candle stick pattern
Features:
  • When the candle appears in an uptrend it is called Hanging man.

A hammer can be warning of a down trend
See the chart above,the price was moving in upward direction and at the peak hanging man appeared. After that the price reversed its direction and started downward journey.
  • When candle appears in a down trend it is called hammer.

A Guide to Forex trading strategies


Debt financing is the one which everyone will be looking into and the question is how easily we can do that. And nowadays there are plenty of ways by which you can easily make money online and off course each one has its own risk reward ratio. If you need a very good profit there would be high risk also and you should be knowing how to manage that risk efficiently and effectively.

And yes there are ways like advertising where you risk is low but you have to put a heavy effort on marketing in this case.

To have a good financial credit history, credit rating or credit score always is a nice thing to have so that you can pay you debts off and have a good financial stability.

One of the popular method is forex trading or currency trading

Forex trading has become one of the beneficial way by which you can make some good profit in Dollars online, provided that you do it carefully by managing the risk that suites your appetite. You can develop your own forex trading strategy which will.

Currency rates keeps on fluctuating and it is mainly depend up on that country’s economy, inflation rate, interest rate, GDP ( Gross domestic profit), employment rate etc. So this is such a big market to get influences or manipulated by a person or a lobby and thus more preferred when comparing with trading in a security market or equity stock market where the stock prices are for a company or organisation’s growth or profit

This website tells and teaches you about some of the very basic and fundamentals of forex trading, forex trading tips and tactics, forex trading fundaments and few tips on technical analysis in a simplified manner. We are trying to post as many descriptive post as possible to that it would be helpful to you to do an easy Forex currency trading. So keep visiting and subscribe to our feed to have them served to you.
Browse through the website (the link list on the right panel) to find and learn more about different currency chart patterns and indicators.


Browse through the website (the link list on the right panel) to find and learn more about different currency chart patterns and indicators

Japanese candlestick chart patterns- part1

The basic idea behind trading is to buy at low price and sell at higher price there by taking a profit and vice versa. So how will you know that the price is going to move up by looking at the chart. This is where Chart patterns comes to play it's role.
Candle stick chart will provide a lot of patterns which will act as a warning signal that the price is going to change it's direction.There are several types of candlestick chart patterns like
  • Reversal patterns
  • Continuation Patterns
Let's look at the Reversal patterns.

Reversal patterns show the trader that the price is likely to change it's direction. If a particular currency is in uptrend and a reversal pattern appear on the chart,this means that the trend may change to downward direction or is going to range.
Reversal pattern doesn't mean that the trend has been completely reversed. Sometimes the reversal will only be for a short time and after that the price will regain its strength and continue it's former trend. The length of reversal depend on various factors like Support and resistance areas, major fundamental developments,market sentiment etc.
1) Engulfing Pattern:
One of the important candlestick  reversal signal. This is a 2 candle pattern which means the pattern include 2 candlesticks. The engulfing pattern can be
  • Bearish engulfing-- occurs in uptrend
  • Bullish engulfing.--occurs in down trend
Bearish Engulfing pattern:

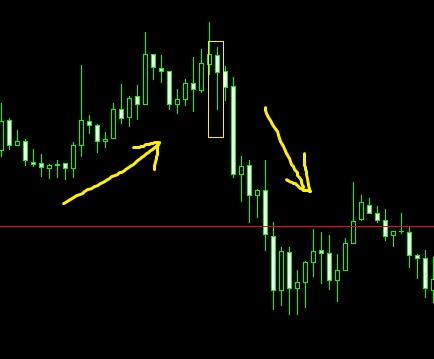
In this pattern there will be 2 candlesticks. The second candlestick will engulf the body of the first candlestick completely.The first one will be a bull candle (or a doji) and the second a bear candle. This pattern gives a warning signal that uptrend is coming to an end.
See the chart above the rectangle enclosed shows a bearish  engulfing bar pattern. In this the second bear candle is so long that it has covered almost 5 previous candles. The more candles enclosed by the second bar the stronger it is.

Round numbers and Very big round Numbers

Round numbers: Price values ending with .0500, .0600 etc

Very big round numbers: Price ending with   .0000, .1000,.2000 etc

Importance:

Round numbers and very big round numbers can act as a supportor resistance level in some cases.

Round number as support and resistance

See the chart above, the encircled portions indicate the rejection from round numbers. The price was coming up and when it reached the level of 1.3000 which is a very big round number the direction of movement reversed. Price couldn’t break that level and it fell down. This is a typical example of round number acting as resistance. The price fell down till a level of 1.2900 which is also a round number and found support at that level.

The language of candle sticks-Basics

Candlestick charts are one of the best tool in technical analysis to understand the movements in the foreign exchange market. The candlesticks when properly read will tell you
  • what has happened in the market for a particular period of time.
  • show you the signals about the possible future movements.
  • clearly gives an idea to the trader, the emotions of the market.
  • easy to analyse when compared to the bar charts
A short History
The origin of candle stick charts dates back to 1700 AD. A Japanese rice merchant Munehissa Homma was the first to introduce the candlestick method and he made a fortune by trading rice with the help of this method.This system became popular in other parts of the world only by 1980's. Nowadays this is the most common charting method among  forex traders.
How to draw a candlestick?
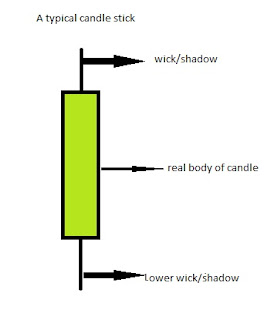
The candle stick is made of a real body and wicks or shadows. The real body shows the opening and closing prices  at a particular time period and the shadows show the highest and lowest price reached during that period.
A typical candlestick